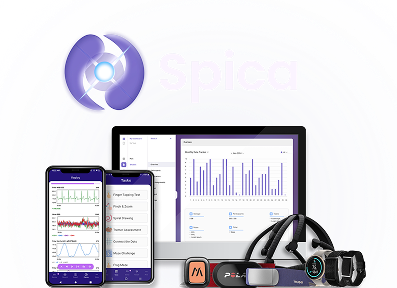
Spica Dashboard
From Data Visualization to Insight,
Every Step of the Way
The Spica Dashboard brings all your study data together in one intuitive interface—designed to help researchers and clinicians monitor, analyze, and understand multimodal data with confidence. From real-time study oversight to post-study exploration, Spica turns complex datasets into clear, actionable insights.
Spica Dashboard Features
Your Study, Fully Under Control
Each study in Spica is managed through a dedicated dashboard that provides a complete overview of progress, participation, and data quality—across pilot, clinical, or large-scale research projects.
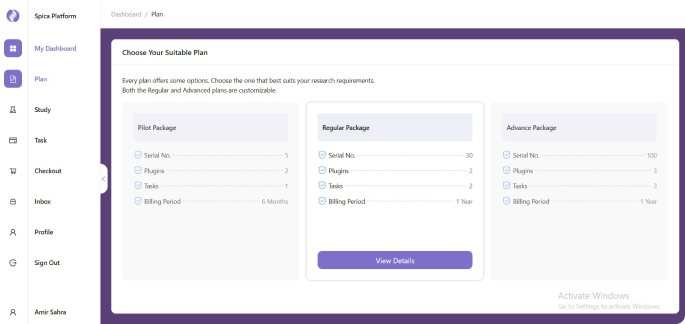
Flexible Study Plans (Choose the setup that fits your research needs):
- • Pilot: Ideal for feasibility studies and early validation
- • Regular: Designed for standard clinical and behavioral studies
- • Advanced: Built for complex, multi-site, high-resolution research
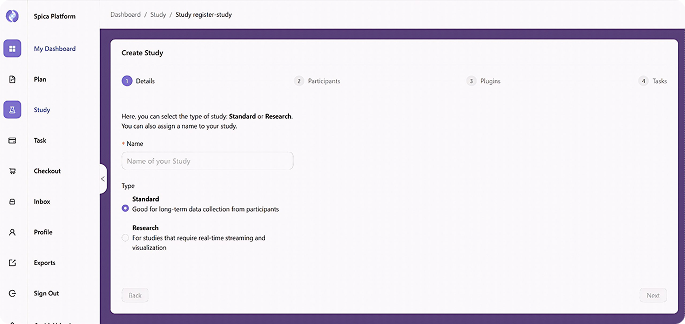
Create a Study
Set up a new study in minutes by defining its name, description, start and end dates, and participant capacity. Each study is fully isolated with its own data namespace, role assignments, and protocol configuration.
Once created, the study workspace becomes the central hub for all downstream configuration—devices, tasks, EMA schedules, and notification rules are all managed from within the study context.
Standard Mode Workflow
Standard Mode is designed for routine clinical data collection where simplicity and adherence are the priority. Participants follow a pre-defined daily routine driven by automated schedules configured by the research coordinator.
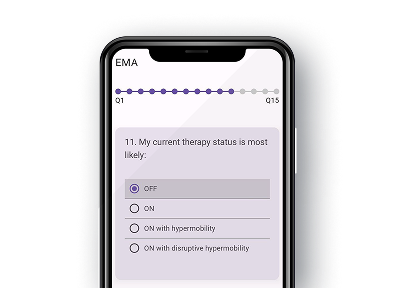
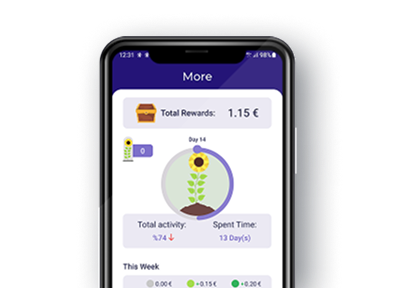
The workflow covers automated data capture, scheduled surveys, clinician notifications, and participant reward milestones—all requiring minimal manual intervention once the study is live.
Research Mode Workflow
Research Mode unlocks the full configurability of the Spica platform for advanced experimental designs. Researchers can define custom task paradigms, adaptive EMA schedules, and fine-grained sensor channel selections per participant or group.
The workflow supports multi-phase study structures, counterbalanced conditions, and real-time event-triggered protocols—giving your team full control over every aspect of the data collection pipeline.
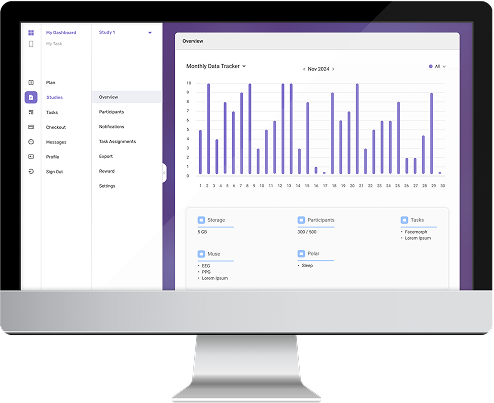
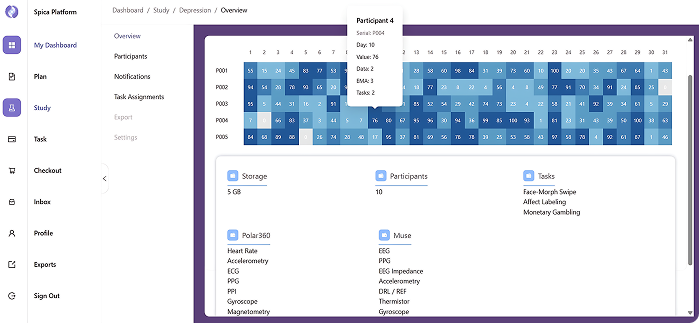
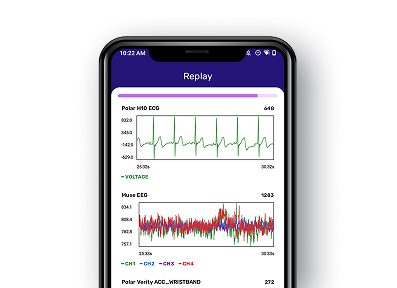
Study Overview
Gain a high-level view of all active studies with real-time enrollment, session completion, and data quality metrics.
Track study-level KPIs including total participants, active sessions, completion rates, and data completeness—all in one dashboard.
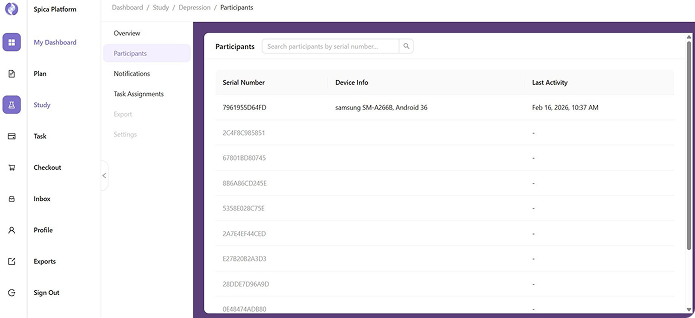
Participants
Monitor individual participant details, session history, and adherence status from a single view. The participants table supports filtering, sorting, and bulk actions for large cohorts.
Drill into any participant profile to review their session timeline, sensor data quality, completed assessments, and reward history—enabling targeted follow-up without leaving the dashboard.
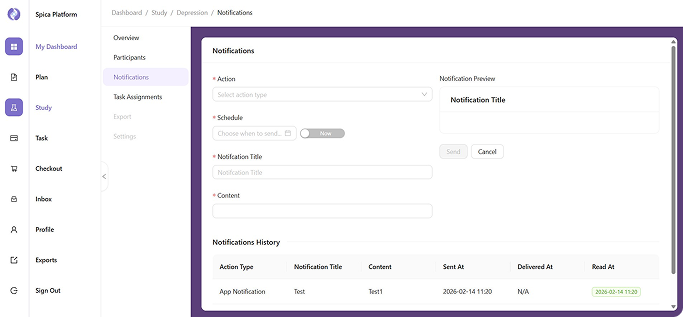
Notifications
Keep your team informed with configurable alerts for missed sessions, anomalous readings, and participant-reported events. Notification rules can be scoped per study, per participant group, or per individual.
Clinicians receive alerts through the dashboard and optionally via push or email, with full delivery logs available for audit and compliance reporting.
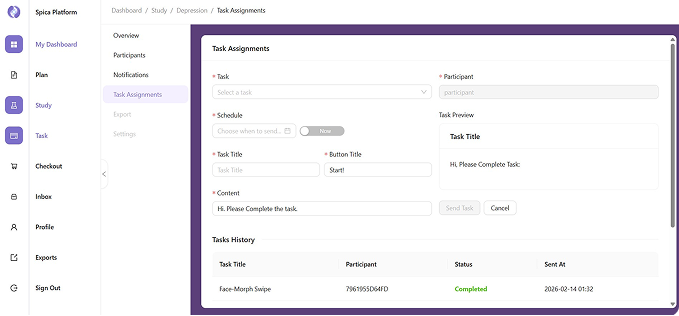
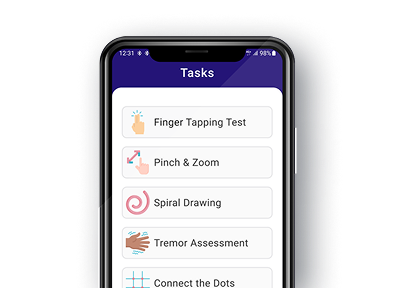
Task Assignments
Assign cognitive, behavioral, and physiological tasks to individual participants or entire cohorts directly from the dashboard. Task schedules can be fixed, randomized, or triggered by events captured from wearable sensors.
Completion status and response quality are tracked in real time, with automatic escalation when a participant falls behind schedule—ensuring data integrity across the full study timeline.
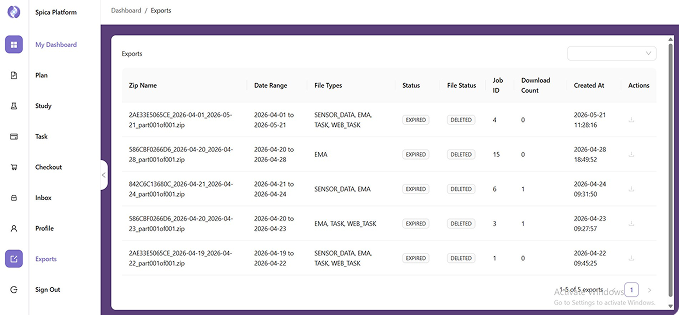
Export Data
Export structured datasets in formats compatible with MATLAB, Python, R, and CSV pipelines. Each export preserves full metadata—timestamps, participant IDs, session labels, and device identifiers—for immediate use in downstream analysis.
Scheduled exports and API-based data pushes are available for teams running automated pipelines, eliminating manual download steps in continuous or longitudinal study designs.
Designed for Real-World Clinical and Research Impact
Spica empowers researchers and clinicians with a unified platform that delivers reliable data, engaged participants, and operational excellence.
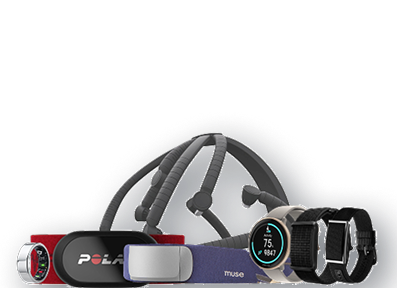
- Reduced Data Fragmentation:
Unifies wearable, EMA, and smartphone data into a single structured system. - Real-World Continuous Monitoring:
Captures longitudinal physiological and behavioral data in naturalistic environments.
- Improved Participant Adherence:
Real-time engagement tracking helps maintain protocol compliance and reduces missing data.
- Scalable Study Design:
Supports studies from small cohorts to multi-site, high-volume clinical trials. - Reduced Operational Workload:
Automates data collection, synchronization, and monitoring workflows to minimize manual effort.
Explore The Spica Platform
See Your Study Data Come to Life
The Spica Dashboard gives your team a shared, live view of every study in progress. From enrollment to final export, every data point is visible, organized, and ready to drive decisions.